Variable Frequency Drive vs. Sinusoidal Supply in motor efficiency
Abstract
In recent years, a lot of attention is focused on improving the efficiency of industrial motors which constitute approximately 60-65% of the total industrial electric energy usage. Several alternatives to traditional and widely used induction motors are being proposed and introduced by motor manufacturers, like permanent magnet (PM) motors and synchronous reluctance motors (SynRM). At the same time, more and more induction motors are now supplied by VFDs (variable frequency drive) because of enormous energy saving potential in applications like pump and fan VFDs. The percentage of variable frequency drives in industrial environment is rising day by day making it one of the top alternatives to achieve energy reduction targets for industries. This also makes equally important to test and experimentally evaluate efficiency performance of motor & VFD system using fast and accurate methods. The efficiency measurement standard IEC 60034-2-1 Ed 1.0 describes the test methods only for line controlled motors and it does not include testing of variable frequency drive motors systems. The upcoming standard specification, IEC 60034-2-31 is intended to describe test methods and required instrumentation specifications while measuring efficiency of variable frequency drive controlled motors. The accuracy of measurement setup and methods is more and more important while testing high efficiency systems since slight errors in the measurements can lead to significant deviations in the measured efficiency. But the efficiency measurement setup accuracies are prone to deteriorate while measuring electrical quantities under variable frequency drive control conditions. This can also lead to large uncertainty in measured efficiency while measuring variable frequency drive controlled motors and the result may be unacceptable if the values are larger than specified tolerance levels for efficiency and losses as per IEC standard 60034-1.
The purpose of this paper is to analyze the direct input-output test methods for faster efficiency evaluation of variable frequency drive controlled motors using the measuring equipment described by standard specifications. The validity of these results is also investigated by estimating the measurement uncertainties from the accuracy specifications of different instruments used in the test measurements. The electrical efficiency is measured using direct input-output and indirect- summation of losses methods as outlined in efficiency measurement standard under sinusoidal and variable frequency drive control conditions. Then the uncertainty of measurement system at different load conditions is evaluated for sinusoidal as well as variable frequency drive supply conditions and compared against the allowable tolerance limits as specified standard specifications.
Introduction
The electric motors are most wide spread and convenient means for electromechanical power conversion in industrial environment, and approximately 60-65% of the total industrial electric energy is consumed by electric motors. The main focus in research environment is both on efficiency enhancement of motor systems through design improvements, use of better materials and alternate, more efficient motor technologies like permanent magnet (PM) motors and synchronous reluctance motors (SynRM). The introduction of VFDs (variable frequency drive) has given a totally different dimension to the energy saving programs in many industrial applications because of enormous energy saving potential in applications like pumps and fan VFDs. The higher efficiency VFDs are increasingly replacing conventional motors, thanks to the energy awareness created by many energy efficiency improvement measures and new regulations which will make it mandatory to use higher efficiency motor systems.
This also makes it equally important to experimentally test the efficiency performance of motor & VFD system using fast and accurate methods. Many standard specifications are specifically formulated to describe the measurement setup requirements and test methods for evaluating the motor efficiencies. For many years there were two main standards (or their subsequent adaptations in local regulations) used around the world to determine these losses: IEC 60034-2 and IEEE 112 method B (or IEEE 112- B). Both standards differ from each other in methods to account for additional stray load losses. The efficiency measurement standard IEC 60034-2-1 Ed 1.0 describes the test methods for line controlled motors whereas the upcoming standard specification, IEC 60034-2-3 is intended for variable frequency drive controlled motors. The accuracy of measurement setup and methods is more and more important while testing high efficiency systems since slight errors in the measurements can lead to significant deviations in the measured efficiency. The accuracy of measurement setup is prone to deteriorate while measuring electrical quantities under variable frequency drive voltage supply. This can also lead to large deviations in measured efficiency values while measuring variable frequency drive controlled motors. The standard equipment to measure power, for ex. precision power analyzer include special functions like line filters which are used to filter higher harmonic components in the measurement of input quantities. Similarly, other functions like, frequency filters are also embedded into power analyzer to increase the ability of power analyzers to correctly determine the fundamental frequency in the case of variable frequency drive supply. But the use of line filter function has adverse effect on the accuracy of power measurement. The result may be unacceptable if the values are larger than specified tolerance levels for efficiency and losses as per IEC standard 60034-1.
The main theme of this paper is thus to analyze change in measurement uncertainties of efficiency measurement setups in variable frequency drive supply conditions. The paper is organized in the following manner. First the brief overview of different standard specifications for motor efficiency measurements is presented. The alternative arrangements for a typical test facility for motor plus motor & VFD system efficiency measurement are presented and different sources of errors in measurements are elaborated. The laboratory measurements are performed on a IE2 efficiency class induction motor using standard test methods under both sinusoidal and variable frequency drive supply conditions. The measurement uncertainties for both sinusoidal and variable frequency drive supply cases are estimated based on the available accuracies of the measurement equipment. Then the effect of using line filters on measurement uncertainty is analyzed for sinusoidal and variable frequency drive supply conditions. In the end, these are compared against the maximum allowable limits defined in standard specifications.
The International Electrotechnical Commission (IEC) has published an international standard IEC 60034-30 which describes the efficiency classes (IE- code) for standard single phase and three phase motors operated from sinusoidal supply. In order to keep pace with the high integration of variable frequency drive controlled motors in industries, this standard is to be split into two parts - Part 1 will cover all motors operated direct on-line and part 2 will cover motors operated on variable voltage and frequency supplied by variable frequency drive. Together with defining the above standard for efficiency classes, IEC has also published a standard for testing the motor efficiency described as "IEC 60034-2-1 (Ed. 1.0): Rotating electrical machines – Part 2-1: Standard methods for determining losses and efficiency from tests (excluding machines for traction vehicles), 2007", which describes test methods to determine motor efficiency from measurement tests. As per IEC 60034-2-1 (Ed. 1.0), the motor efficiency can determined in number of ways, for ex. measuring input and output powers directly or measuring the motor loss components separately and the efficiency can be estimated by summing the total losses. Table 1 describes the summary of preferred test methods as per IEC 60034-2-1.
Each of above described methods has certain advantages as well as drawbacks with respect to cost, accuracy and complexity of testing. Even with the use of a consistent and accurate efficiency test method, variations in results for the same motor do occur, primarily due to ambient conditions, instrument characteristics and personnel factors in the case of non-automated testing.
Table 1: Preferred methods for efficiency determination of sinusoidal supply controlled motors
When the motors are supplied with variable frequency drive voltages, there is increase in motor losses which is mainly due to additional harmonic losses. Upcoming standard specification, IEC 60034-2-32 describes different methods and test procedures to measure these additional losses. The standard also introduces the concept of a test VFD- which is a variable frequency drive voltage source with defined and reproducible harmonic content to supply the motor under test (how to test a VFD?). In this way, it is possible to measure and compare losses for motors being supplied by variable frequency drives from different manufacturers. The scope of this standard is limited only to determine the additional harmonic motor losses resulting from non-sinusoidal power supply- consequently the efficiency of the variable frequency drive -fed motor. Thus it does not address methods to determine the efficiency of complete Power Drive System (PDS), this has been the topic for other standards in pipeline to define efficiency of complete Power Drive System.
As long as the test methods and measuring equipments are used according to the efficiency measurement standards as described above, the test result shall not exceed the allowed deviation as specified by standard. The required tolerances for different values which are printed on the motor nameplate are defined in IEC 60034-1. This tolerance limits are not only for measurement limits but both variations in manufacturing, material properties together with measurement tolerances. The specified values for motor efficiency and motor losses are shown in Table 2.
Table 2: Tolerance limits for motor loss and efficiency as per IEC 60034-1
Motor or motor & VFD system manufacturers should now print the IE efficiency class on motor nameplate, together with the actual efficiency values. The manufacturer needs to have the efficiency situation under control by doing type tests per product variant (not on all motors that leave the factory), the possible difference in measured efficiency shall be within the tolerance limit- this accounts for both measurement and manufacturing tolerances. The above requirement puts stringent requirements on the accuracy of measurement equipments and measurement procedures.
Requirements for efficiency measurement system in a typical industrial environment
Because of the advancement in the instrumentation and measurement system, the power measurement has been made much easier with introduction of advanced power measurement equipment and systems. There are many suppliers in market who can provide dedicated instruments for power measurement under different operating scenarios. Many of these instrumentation systems offer multiple types of interfaces for electrical and mechanical quantities being measured as per measurement standards. The selection and sizing of the measurement equipment has great impact on uncertainty of efficiency measurements. The discussion henceforth in this paper is focused on measurement system using the precision power analyzers and associated data acquisition accessories. The precision power analyzer allows different alternatives for current measurement. Current measurement by passing current directly through series elements is possible for small motor sizes. But current transformers or transducers have to be used to measure currents of much higher amplitudes than current rating of series element. This will result into the degradation in the accuracy because of the errors introduced by additional shunt or transducer.
The test setup for measuring motor efficiency is shown in Figure 1 which employs motor current sensing through use of current transducers. The mechanical arrangement consist of test motor coupled with a load machine with a torque transducer in between for measuring mechanical quantities like load torque, speed and mechanical power.

Figure 1: Measurement setup configuration wiring schematic
The load machine is supplied through a variable frequency drive (load VFD) which controls the load machine to apply specific load torque on the shaft. The test motor is either connected directly to supply mains or through a variable frequency drive (test VFD) depending upon the measurements. The test VFD is used to supply the motor with variable frequency to rotate it at different speeds. The test motor used in this study is 15 kW, IE2 efficiency class (400 V, 50 Hz, 1500 rpm) induction motor. The electrical as well as mechanical power measurement is done by power analyzers since all electrical signal as wells as torque and speed information is input to power analyzers. Thus the power analyzer is capable of directly measuring electrical, mechanical powers, motor losses as well as motor efficiency.
The accuracy of the measurement system is of prime important as described in previous sections. For best results, direct interface of motor current and voltage through power measuring instrument is preferred. This measurements system with low instrument count is less prone to large deviations in overall measurement inaccuracies. But using intermediate equipments like current or voltage transducers adds complexity and contributes to its own share of uncertainty in efficiency measurement. Some of the prime factors which should be considered, while selection of measurement setups, are:
Estimation of measurement uncertainties
This section describes the procedure followed to estimate measurement uncertainty for the measurement setup used in this study. The procedure is similar to one already reported by others, with the difference that the actual accuracy levels of different instruments are considered from manufacturers datasheets. The accuracy values are valid under standard environmental condition, like ambient temperature, humidity, calibration state. Deviation from the standard testing conditions leads to the deviation in instrument accuracy. The instrument manufactures generally provide the respective scaling factors to instrument accuracy when the test condition differs from standard operating conditions. The different accuracy specifications and scaling factors for the measurement setup shown in Figure 1 are described in Table 3. The different values shown in Table 3 are obtained from manufacturers catalogues.
Table 3: accuracy specifications for different instruments on the measurement setup
The effect of temperature changes after zero level compensation, range change and the effect of self-generated heat caused by current input are neglected in this exercise.
It can be seen from Table 3 that accuracy limits for precision power analyzers under variable frequency drive supply conditions are much higher than the case for sinusoidal supply conditions and thus it will have major impact on the accuracy of efficiency measurements under variable frequency drive voltage supply. To highlight the above facts, the overall uncertainty estimation in input power, output power and efficiency of the motor has been performed where motor is operating at nominal load as described in Table 4.
Table 4: example case for determination of measurement uncertainty at nominal operating condition
The uncertainly estimation is performed for three situations- "A", "B" and "C", these conditions are derived based on the state of different instruments used in the measurement setup. The Table 5 describes such conditions for respective cases.
Table 5: Different scenarios considered for uncertainty estimation
Scenario A
Scenario A is the worst case condition, referred to the situation when the current transducers, power analyzer are not calibrated at intervals specified by manufacturer, line filters are enabled in the measurements and the torque transducer also shows deviation from calibration state. The respective power and efficiency measurements along with estimated uncertainty in this situation are shown in Table 6 for both sinusoidal and variable frequency drive supply conditions. As expected, the measurement uncertainty is higher with variable frequency drive supply conditions. Overall, the uncertainty estimates are much higher than expected limits for such measurements.
Scenario B
Scenario B refers to best case situation where all measurement instruments are calibrated as per specifications. The only influencing factors under this situation are instrument accuracies. The resulting estimation inaccuracies are shown in Table 6. As expected, the efficiency uncertainty is much lower and within acceptable limits.
Scenario C
Scenario C is most likely case similar to scenario B but line filters function in power analyzers is activated in the measurements. Thus the respective scaling factors have to be considered for estimating the measurement inaccuracy. The resulting uncertainty estimates are also shown in Table 6. It is obvious that the added scaling in inaccuracy due to line filters result in much higher uncertainty than the scenario B.
The estimated values under above conditions are tabulated in Table 6, where "+ve and –ve deviation" are the actual maximum values for the respective parameters i.e. the "+ve or –ve Diff" plus actual measurement. "+% and -%" shows the deviation normalized to actual measured value.
Table 6: Estimated measurement uncertainty under different instrument conditions
From the above analysis, the following guidelines should be followed in order to keep the measurements within reasonable accuracy range.
The efficiency of the test motor is measured using direct input-output and segregation of loss methods outlined in the IEC standard specifications (IEC 60034-2-1 & IEC00034-2-3). The measurements have been carried out with both sinusoidal and variable frequency drive supply conditions.
Motor loss and efficiency determination under sinusoidal supply
Motor efficiency is measured under sinusoidal supply conditions as per the test procedure outlined in IEC60034-2-1. First the heat run test performed at different loading conditions and the efficiency is measured as per direct input-output method. This is followed by indirect efficiency measurement as described in "Method 2- summation of losses, residual losses estimated from stray losses". The different results from above tests are summarized Table 7 for sinusoidal supply conditions.
Table 7: Measured loss and efficiency under sinusoidal supply
The efficiency of the test motor is also measured with variable frequency drive supply at similar load conditions using direct and indirect test method. The motor is now supplied from a Gozuk industrial VFD which operates the motor at rated speed in speed control mode. As outlined in IEC 60034-2-3, "test method 2-3-B summation of losses- Manufacturer specific VFD supply, additional harmonic loss determination using final application specific VFD" is used to determine motor loss components and "test method 2-3-C Input-Output method" is used to measure motor losses directly (The method is similar to the method 1 Direct input-output power measurement described in IEC 60034-2-1).
The different results from above tests are summarized Table 7 for sinusoidal supply conditions and in Table 8 for variable frequency drive supply conditions. Figure 2 shows the motor efficiency under sinusoidal and variable frequency drive supply conditions, whereas the motor losses under different loading condition are shown in Figure 3.
Table 8: Measured loss and efficiency with variable frequency drive supply at rated speed of 1500 rpm

Figure 2: Comparison of motor efficiency under sinusoidal and variable frequency drive supply conditions

Figure 3: Comparison of motor losses under sinusoidal and variable frequency drive supply conditions
It is observed that the efficiency measured with direct input – output method is lower than that determined using indirect method. This is true for both sinusoidal as well as variable frequency drive supply conditions. The measured efficiency value at rated load confirm to the IE2 efficiency level under sinusoidal supply condition. The efficiency decreases under variable frequency drive supply, owing to the increase in iron losses (additional harmonic losses in the motor iron core, rotor eddy current losses, etc.). The relative increase in losses due to variable frequency drive supply is also indicated in Table 8 as a percent of sinusoidal losses at similar load conditions. It is observed from Table 8 that the maximum increase is ~11% and 9 % for measurements using direct input-output method and indirect summation of loss method, respectively. The losses in sinusoidal and variable frequency drive supply conditions cannot be compared at 115% load conditions because of the VFD voltage limitations at this operating point. The estimation of uncertainty in the above described efficiency values is the main aim of this paper. This has been addressed in next section where the measurement uncertainties are estimated based on the procedure described in previous section and then compared with specified tolerance limits in standard specifications.
The procedure for estimation of measurement uncertainties, described in previous section, is carried out for all load conditions for both sinusoidal and variable frequency drive supply conditions. To analyze the effect of line filters on measurement uncertainty, the measurement uncertainties are estimated for both the cases – with and without use of filter function (scenario B and C respectively) for sinusoidal and variable frequency drive supply conditions. Then the resulting values are compared with tolerance limits to evaluate if the measurement is satisfactory or not.
Uncertainty estimation without line filter (Scenario B)
The measured values of voltage, current and power quantities as well as current range selected by the instruments are used to derive the uncertainties at different load conditions for sinusoidal supply conditions. The results are reported in Figure 4 for efficiency values and in Figure 5 for measured loss values. Similar exercise is also carried out to determine measurement uncertainty for measurement tests with variable frequency drive supply conditions. The respective values are also shown in Figure 4 and Figure 5 for efficiency and measured loss respectively. The various scaling factors for different measurement instruments are taken from Table 3 for variable frequency drive supply conditions.
Uncertainty estimation with line filter active (Scenario C)
The enabling of line filter function in power analyzers inserts the line filter into the voltage and current measurement input circuit, it directly affects the voltage, current, and power measurements. This results in filtering of input voltage and current signals. High frequency components are filtered out depending upon the selected cut-off frequency. The line filter has minimal effect on measurements in the situation when motor is supplied with sinusoidal voltages, but the measurements in case of variable frequency drive voltages are affected by line filter selection. The accuracy specifications of the power analyzers are thus dependent upon line filter state since activating line filter adds additional scaling factor in uncertainty estimation as described in Table 3.
The effect of line filter on the measurement uncertainty is estimated by considering scaling of power analyzer accuracy values as described in Table 3. The overall uncertainty in motor efficiency and motor losses under sinusoidal supply conditions is shown in Figure 6 and Figure 7, respectively. The measurement uncertainty for variable frequency drive supply condition is also estimated as described above and the results are shown in Figure 6 and Figure 7 for motor efficiency and motor losses, respectively.

Figure 4: Measurement uncertainty in motor efficiency values without line filters

Figure 5: Measurement uncertainty in motor losses without line filters

Figure 6: Measurement uncertainty in motor efficiency values with line filters

Figure 7: Measurement uncertainty in motor losses with line filters
Comparison of measurement uncertainty with tolerance limits
The recommended error tolerance limits for motor efficiency as per IEC 60034-1 applicable to induction motor of 15 kW power rating is -15% of (1- η). Based on the measured efficiency values at different load conditions the tolerance limits are calculated for both sinusoidal and variable frequency drive supply conditions. The results are shown in Figure 8 with dotted lines (blue- sinusoidal supply condition, red- variable frequency drive supply). Figure 8 also shows the estimated uncertainty in efficiency from actual measurements for both variable frequency drive and sinusoidal supply conditions (continuous blue and red lines). Figure 8 (a) shows the comparison of estimated uncertainty when the line filter function was not used. In this condition, the actual uncertainty is well below the maximum tolerance levels for both sinusoidal and variable frequency drive supply conditions.
Similar procedure is followed for the case when the line filter function is activated. The comparison between estimated uncertainty and tolerance limits are shown in Figure 8 (b). In this scenario, the estimated uncertainty for sinusoidal supply test is lower than the tolerance levels but it exceeds the limits in case of variable frequency drive supply conditions. Thus the line filter function is having adverse effects in measurements with variable frequency drive supply conditions. The measurement uncertainty is more than manufacturing tolerance limits.

Figure 8: Estimated tolerance limits in motor efficiency at rated speed (dotted curve- maximum tolerance limits - 15% of (1-η) as per IEC60034-1 standard specification)
Similar comparison is also mode for motor losses. Figure 9 (a) shows measurement uncertainty (% of total loss) in motor loss for the case when line filter is in disabled condition. The tolerance limits in motor losses are defined as -10% of motor loss as per IEC 60034-1 (for motor rating >150 kW). But for lower than 150 kW motor rating, the tolerance limits are not described. Hence, it is assumed to be equal 15% (tolerance limits for efficiency values). It is seen that the measurement uncertainty in case of sinusoidal supply are well within tolerance limits (<6%), whereas with variable frequency drive supply it is much higher (7-10%) depending upon load conditions.
The similar procedure is followed for the scenario in which line filter is enabled and the resulting measurement uncertainty values are shown in Figure 9(b). Clearly, line filter has adverse effect under both sinusoidal and variable frequency drive conditions. The results for sinusoidal supply conditions are approximately 10%, but for a variable frequency drive supply test, the measurement uncertainty is greater than manufacturing tolerance levels (i.e. 15%). The uncertainty in motor loss at 100% and 115% load conditions is lower than respective value at 75% load condition. This is because of the selection of "auto scale mode" of power analyzer which automatically selects the best scaling factor for depending upon the RMS value of measured quantity.

Figure 9: Measurement uncertainty in motor losses
The following conclusions can be drawn from the foregoing analysis of measurement uncertainty estimation:
Conclusions
The paper presents the effect of instrument accuracies on the overall uncertainty in efficiency measurement described as in direct input-output methods as per IEC 60034-2-1. The measurement instrumentation normally has higher error margins for variable frequency drive supply conditions as compared to sinusoidal supply. This results in higher values of estimated uncertainty in efficiency during measurement under variable frequency drive supply conditions. The efficiency measurement is performed on an induction motor under both sinusoidal and VFD controlled supply conditions at rated speed. The percentage increase in motor losses during VFD controlled supply is found to be linearly increasing with respect to load condition. This is very different observation than the assumption made in IEC 60034- 2-3 that the additional motor loss due to VFD controlled supply is independent of motor loading.
Then the uncertainty estimation is performed on measured efficiency under both sinusoidal and VFD controlled supply conditions. It is observed from estimated uncertainty values are below maximum limits described as per IEC 60034-1 standard specification when measurements are performed with line filter functions in power analyzers is disabled. This is applicable for both sinusoidal and VFD control measurement tests. But measurement uncertainty is much higher when line filters are activated for measurements with variable frequency drive supply conditions. In this situation, the estimated uncertainty values are very close or higher than allowed tolerance limits. It is recommended that the use of line filters should be avoided under such situations.
In recent years, a lot of attention is focused on improving the efficiency of industrial motors which constitute approximately 60-65% of the total industrial electric energy usage. Several alternatives to traditional and widely used induction motors are being proposed and introduced by motor manufacturers, like permanent magnet (PM) motors and synchronous reluctance motors (SynRM). At the same time, more and more induction motors are now supplied by VFDs (variable frequency drive) because of enormous energy saving potential in applications like pump and fan VFDs. The percentage of variable frequency drives in industrial environment is rising day by day making it one of the top alternatives to achieve energy reduction targets for industries. This also makes equally important to test and experimentally evaluate efficiency performance of motor & VFD system using fast and accurate methods. The efficiency measurement standard IEC 60034-2-1 Ed 1.0 describes the test methods only for line controlled motors and it does not include testing of variable frequency drive motors systems. The upcoming standard specification, IEC 60034-2-31 is intended to describe test methods and required instrumentation specifications while measuring efficiency of variable frequency drive controlled motors. The accuracy of measurement setup and methods is more and more important while testing high efficiency systems since slight errors in the measurements can lead to significant deviations in the measured efficiency. But the efficiency measurement setup accuracies are prone to deteriorate while measuring electrical quantities under variable frequency drive control conditions. This can also lead to large uncertainty in measured efficiency while measuring variable frequency drive controlled motors and the result may be unacceptable if the values are larger than specified tolerance levels for efficiency and losses as per IEC standard 60034-1.
The purpose of this paper is to analyze the direct input-output test methods for faster efficiency evaluation of variable frequency drive controlled motors using the measuring equipment described by standard specifications. The validity of these results is also investigated by estimating the measurement uncertainties from the accuracy specifications of different instruments used in the test measurements. The electrical efficiency is measured using direct input-output and indirect- summation of losses methods as outlined in efficiency measurement standard under sinusoidal and variable frequency drive control conditions. Then the uncertainty of measurement system at different load conditions is evaluated for sinusoidal as well as variable frequency drive supply conditions and compared against the allowable tolerance limits as specified standard specifications.
Introduction
The electric motors are most wide spread and convenient means for electromechanical power conversion in industrial environment, and approximately 60-65% of the total industrial electric energy is consumed by electric motors. The main focus in research environment is both on efficiency enhancement of motor systems through design improvements, use of better materials and alternate, more efficient motor technologies like permanent magnet (PM) motors and synchronous reluctance motors (SynRM). The introduction of VFDs (variable frequency drive) has given a totally different dimension to the energy saving programs in many industrial applications because of enormous energy saving potential in applications like pumps and fan VFDs. The higher efficiency VFDs are increasingly replacing conventional motors, thanks to the energy awareness created by many energy efficiency improvement measures and new regulations which will make it mandatory to use higher efficiency motor systems.
This also makes it equally important to experimentally test the efficiency performance of motor & VFD system using fast and accurate methods. Many standard specifications are specifically formulated to describe the measurement setup requirements and test methods for evaluating the motor efficiencies. For many years there were two main standards (or their subsequent adaptations in local regulations) used around the world to determine these losses: IEC 60034-2 and IEEE 112 method B (or IEEE 112- B). Both standards differ from each other in methods to account for additional stray load losses. The efficiency measurement standard IEC 60034-2-1 Ed 1.0 describes the test methods for line controlled motors whereas the upcoming standard specification, IEC 60034-2-3 is intended for variable frequency drive controlled motors. The accuracy of measurement setup and methods is more and more important while testing high efficiency systems since slight errors in the measurements can lead to significant deviations in the measured efficiency. The accuracy of measurement setup is prone to deteriorate while measuring electrical quantities under variable frequency drive voltage supply. This can also lead to large deviations in measured efficiency values while measuring variable frequency drive controlled motors. The standard equipment to measure power, for ex. precision power analyzer include special functions like line filters which are used to filter higher harmonic components in the measurement of input quantities. Similarly, other functions like, frequency filters are also embedded into power analyzer to increase the ability of power analyzers to correctly determine the fundamental frequency in the case of variable frequency drive supply. But the use of line filter function has adverse effect on the accuracy of power measurement. The result may be unacceptable if the values are larger than specified tolerance levels for efficiency and losses as per IEC standard 60034-1.
The main theme of this paper is thus to analyze change in measurement uncertainties of efficiency measurement setups in variable frequency drive supply conditions. The paper is organized in the following manner. First the brief overview of different standard specifications for motor efficiency measurements is presented. The alternative arrangements for a typical test facility for motor plus motor & VFD system efficiency measurement are presented and different sources of errors in measurements are elaborated. The laboratory measurements are performed on a IE2 efficiency class induction motor using standard test methods under both sinusoidal and variable frequency drive supply conditions. The measurement uncertainties for both sinusoidal and variable frequency drive supply cases are estimated based on the available accuracies of the measurement equipment. Then the effect of using line filters on measurement uncertainty is analyzed for sinusoidal and variable frequency drive supply conditions. In the end, these are compared against the maximum allowable limits defined in standard specifications.
Overview of motor efficiency classes and measurement methods
The International Electrotechnical Commission (IEC) has published an international standard IEC 60034-30 which describes the efficiency classes (IE- code) for standard single phase and three phase motors operated from sinusoidal supply. In order to keep pace with the high integration of variable frequency drive controlled motors in industries, this standard is to be split into two parts - Part 1 will cover all motors operated direct on-line and part 2 will cover motors operated on variable voltage and frequency supplied by variable frequency drive. Together with defining the above standard for efficiency classes, IEC has also published a standard for testing the motor efficiency described as "IEC 60034-2-1 (Ed. 1.0): Rotating electrical machines – Part 2-1: Standard methods for determining losses and efficiency from tests (excluding machines for traction vehicles), 2007", which describes test methods to determine motor efficiency from measurement tests. As per IEC 60034-2-1 (Ed. 1.0), the motor efficiency can determined in number of ways, for ex. measuring input and output powers directly or measuring the motor loss components separately and the efficiency can be estimated by summing the total losses. Table 1 describes the summary of preferred test methods as per IEC 60034-2-1.
Each of above described methods has certain advantages as well as drawbacks with respect to cost, accuracy and complexity of testing. Even with the use of a consistent and accurate efficiency test method, variations in results for the same motor do occur, primarily due to ambient conditions, instrument characteristics and personnel factors in the case of non-automated testing.
Table 1: Preferred methods for efficiency determination of sinusoidal supply controlled motors
|
Ref |
Method |
Description |
Application |
|
2-1-1A |
Direct measurement: Input-Output |
Torque measurement |
All single phase machines |
|
2-1-1B |
Summation of losses: Residual losses |
PLL determined from residual loss |
Three phase machines with rated output power up to 2 MW |
|
2-1-1C |
Summation of losses: Assigned value |
PLL from assigned value |
Three phase machines with rated output power 2 MW and greater |
When the motors are supplied with variable frequency drive voltages, there is increase in motor losses which is mainly due to additional harmonic losses. Upcoming standard specification, IEC 60034-2-32 describes different methods and test procedures to measure these additional losses. The standard also introduces the concept of a test VFD- which is a variable frequency drive voltage source with defined and reproducible harmonic content to supply the motor under test (how to test a VFD?). In this way, it is possible to measure and compare losses for motors being supplied by variable frequency drives from different manufacturers. The scope of this standard is limited only to determine the additional harmonic motor losses resulting from non-sinusoidal power supply- consequently the efficiency of the variable frequency drive -fed motor. Thus it does not address methods to determine the efficiency of complete Power Drive System (PDS), this has been the topic for other standards in pipeline to define efficiency of complete Power Drive System.
As long as the test methods and measuring equipments are used according to the efficiency measurement standards as described above, the test result shall not exceed the allowed deviation as specified by standard. The required tolerances for different values which are printed on the motor nameplate are defined in IEC 60034-1. This tolerance limits are not only for measurement limits but both variations in manufacturing, material properties together with measurement tolerances. The specified values for motor efficiency and motor losses are shown in Table 2.
Table 2: Tolerance limits for motor loss and efficiency as per IEC 60034-1
|
Motor efficiency (η)3 - For machines up to 150 kW (or kVA) - for machines above 150 kW (or kVA) |
-15% of (1- η) -10% of (1- η) |
|
Motor losses for machines above 150 kW (or kVA) |
+10% of total motor losses |
Motor or motor & VFD system manufacturers should now print the IE efficiency class on motor nameplate, together with the actual efficiency values. The manufacturer needs to have the efficiency situation under control by doing type tests per product variant (not on all motors that leave the factory), the possible difference in measured efficiency shall be within the tolerance limit- this accounts for both measurement and manufacturing tolerances. The above requirement puts stringent requirements on the accuracy of measurement equipments and measurement procedures.
Requirements for efficiency measurement system in a typical industrial environment
Because of the advancement in the instrumentation and measurement system, the power measurement has been made much easier with introduction of advanced power measurement equipment and systems. There are many suppliers in market who can provide dedicated instruments for power measurement under different operating scenarios. Many of these instrumentation systems offer multiple types of interfaces for electrical and mechanical quantities being measured as per measurement standards. The selection and sizing of the measurement equipment has great impact on uncertainty of efficiency measurements. The discussion henceforth in this paper is focused on measurement system using the precision power analyzers and associated data acquisition accessories. The precision power analyzer allows different alternatives for current measurement. Current measurement by passing current directly through series elements is possible for small motor sizes. But current transformers or transducers have to be used to measure currents of much higher amplitudes than current rating of series element. This will result into the degradation in the accuracy because of the errors introduced by additional shunt or transducer.
Test setup for measurement of motor and VFD system efficiency
The test setup for measuring motor efficiency is shown in Figure 1 which employs motor current sensing through use of current transducers. The mechanical arrangement consist of test motor coupled with a load machine with a torque transducer in between for measuring mechanical quantities like load torque, speed and mechanical power.
Figure 1: Measurement setup configuration wiring schematic
The load machine is supplied through a variable frequency drive (load VFD) which controls the load machine to apply specific load torque on the shaft. The test motor is either connected directly to supply mains or through a variable frequency drive (test VFD) depending upon the measurements. The test VFD is used to supply the motor with variable frequency to rotate it at different speeds. The test motor used in this study is 15 kW, IE2 efficiency class (400 V, 50 Hz, 1500 rpm) induction motor. The electrical as well as mechanical power measurement is done by power analyzers since all electrical signal as wells as torque and speed information is input to power analyzers. Thus the power analyzer is capable of directly measuring electrical, mechanical powers, motor losses as well as motor efficiency.
Factors affecting the accuracy of measurement system
The accuracy of the measurement system is of prime important as described in previous sections. For best results, direct interface of motor current and voltage through power measuring instrument is preferred. This measurements system with low instrument count is less prone to large deviations in overall measurement inaccuracies. But using intermediate equipments like current or voltage transducers adds complexity and contributes to its own share of uncertainty in efficiency measurement. Some of the prime factors which should be considered, while selection of measurement setups, are:
- Motor current interface- Insertion of current sensing element directly into current path contributes to least uncertainties in measurement. This results into the best accuracy since the errors associated with current transducers are eliminated. Of course, this is possible only for small motors where the current ratings of motors are sufficiently lower than capacity of current sensing elements of commercially available power analyzers.
- The voltage inputs are directly connected to the power analyzer voltage inputs or through suitable potential divider circuitry when the voltages are higher than rating of voltage rating of power analyzers.
- The torque and speed signal input to the power analyzers are either analogue or digital (or frequency) type, the digital inputs are preferred over analogue inputs for higher accuracy.
- Number and Capacity of test setups
- Precision power analyzers
Estimation of measurement uncertainties
This section describes the procedure followed to estimate measurement uncertainty for the measurement setup used in this study. The procedure is similar to one already reported by others, with the difference that the actual accuracy levels of different instruments are considered from manufacturers datasheets. The accuracy values are valid under standard environmental condition, like ambient temperature, humidity, calibration state. Deviation from the standard testing conditions leads to the deviation in instrument accuracy. The instrument manufactures generally provide the respective scaling factors to instrument accuracy when the test condition differs from standard operating conditions. The different accuracy specifications and scaling factors for the measurement setup shown in Figure 1 are described in Table 3. The different values shown in Table 3 are obtained from manufacturers catalogues.
Table 3: accuracy specifications for different instruments on the measurement setup
|
Instrument |
measured quantity |
Measured quantity |
Expression form |
Sinus. Supply (50Hz) |
Variable frequency drive supply |
|
Torque transducer |
Torque |
Accuracy Rotating Speed influence |
± (% reading) % per1000 rpm |
0.1 0.01 |
0.1 0.01 |
|
Speed |
- |
± (% reading) |
0.1 |
0.1 |
|
|
Current Transducer |
Current |
Accuracy Conductor position effect |
±(% reading + 30 uA) ± % of reading |
0.05 0.01 |
0.05 0.01 |
|
Precision power analyzer |
Mechanical power |
Torque input (Analog) Speed input (pulse) |
±(reading error + measurement range error) ±(reading error + mHz) |
0.1, 0.1 0.05, 1 |
0.1, 0.1 0.05, 1 |
|
Electrical measurements Line filter influence |
Current, Voltage Power |
±(reading error + measurement range error) ±(reading error + measurement range error) |
0.01, 0.03 0.02, 0.04 |
0.1, 0.05 0.15, 0.1 |
|
|
Current Voltage Power |
% of reading % of reading % of reading |
0.2 0.2 0.3 |
0.5 0.2 1 |
||
|
One year accuracy |
% times 6 month accuracy |
|
1.5 |
1.5 |
|
|
Temperature coefficient (Valid for range 5 to 18°C or 28 to 40°C) |
Add ±0.02% of reading /°C |
- |
- |
||
The effect of temperature changes after zero level compensation, range change and the effect of self-generated heat caused by current input are neglected in this exercise.
Effect of variable frequency drive supply on measurement uncertainty
It can be seen from Table 3 that accuracy limits for precision power analyzers under variable frequency drive supply conditions are much higher than the case for sinusoidal supply conditions and thus it will have major impact on the accuracy of efficiency measurements under variable frequency drive voltage supply. To highlight the above facts, the overall uncertainty estimation in input power, output power and efficiency of the motor has been performed where motor is operating at nominal load as described in Table 4.
Table 4: example case for determination of measurement uncertainty at nominal operating condition
|
Current |
30.2 |
A |
|
Voltage |
218 |
V |
|
Power Factor |
0.84 |
- |
|
Power |
16.65 |
kW |
|
Torque |
98.56 |
Nm |
|
Speed |
1465.4 |
rpm |
|
Power |
15.125 |
kW |
The uncertainly estimation is performed for three situations- "A", "B" and "C", these conditions are derived based on the state of different instruments used in the measurement setup. The Table 5 describes such conditions for respective cases.
Table 5: Different scenarios considered for uncertainty estimation
|
|
Scenario A |
Scenario B |
Scenario C |
|
|
Electrical inputs |
Accuracy - ±(reading error + measurement range error) |
considered |
considered |
considered |
|
Line filter influence - Add 0.5% of reading |
considered |
Not considered |
considered |
|
|
One year accuracy reading error of accuracy at 6 months × 0.5 |
considered |
Not considered |
Not considered |
|
|
Mechanical inputs |
Accuracy error- Analog ±(reading error + measurement range error), Pulse ±(reading error + mHz) |
considered |
considered |
considered |
|
Conversion factor deviation from calibration |
present |
Not present |
Not present |
|
Scenario A
Scenario A is the worst case condition, referred to the situation when the current transducers, power analyzer are not calibrated at intervals specified by manufacturer, line filters are enabled in the measurements and the torque transducer also shows deviation from calibration state. The respective power and efficiency measurements along with estimated uncertainty in this situation are shown in Table 6 for both sinusoidal and variable frequency drive supply conditions. As expected, the measurement uncertainty is higher with variable frequency drive supply conditions. Overall, the uncertainty estimates are much higher than expected limits for such measurements.
Scenario B
Scenario B refers to best case situation where all measurement instruments are calibrated as per specifications. The only influencing factors under this situation are instrument accuracies. The resulting estimation inaccuracies are shown in Table 6. As expected, the efficiency uncertainty is much lower and within acceptable limits.
Scenario C
Scenario C is most likely case similar to scenario B but line filters function in power analyzers is activated in the measurements. Thus the respective scaling factors have to be considered for estimating the measurement inaccuracy. The resulting uncertainty estimates are also shown in Table 6. It is obvious that the added scaling in inaccuracy due to line filters result in much higher uncertainty than the scenario B.
The estimated values under above conditions are tabulated in Table 6, where "+ve and –ve deviation" are the actual maximum values for the respective parameters i.e. the "+ve or –ve Diff" plus actual measurement. "+% and -%" shows the deviation normalized to actual measured value.
Table 6: Estimated measurement uncertainty under different instrument conditions
|
Instrument scenario |
|
Reading |
+ve deviation |
-ve deviation |
+ve Diff. |
-ve Diff. |
+% |
-% |
|
|
A |
Mech. power |
15124.90 |
15200.14 |
15049.83 |
75.24 |
75.07 |
0.50 |
-0.50 |
|
|
Electrical power |
Sinus |
16648.27 |
16746.18 |
16550.36 |
97.91 |
97.91 |
0.59 |
-0.59 |
|
|
VFD |
16648.27 |
16980.46 |
16316.09 |
332.18 |
332.18 |
2.00 |
-2.00 |
||
|
Motor Efficiency |
Sinus |
90.8 |
91.8 |
89.9 |
- |
- |
1.0 |
1.0 |
|
|
VFD |
90.8 |
93.2 |
88.6 |
- |
- |
2.3 |
2.2 |
||
|
B |
Mech. power |
15124.90 |
15184.96 |
15064.96 |
60.06 |
59.94 |
0.40 |
-0.40 |
|
|
Electrical power |
Sinus |
16648.27 |
16669.60 |
16626.94 |
21.33 |
21.33 |
0.13 |
-0.13 |
|
|
VFD |
16648.27 |
16718.25 |
16578.30 |
69.97 |
69.97 |
0.42 |
-0.42 |
||
|
Motor Efficiency |
Sinus |
90.8 |
91.3 |
90.4 |
- |
- |
0.5 |
0.5 |
|
|
VFD |
90.8 |
91.6 |
90.1 |
- |
- |
0.7 |
0.7 |
||
|
C |
Mech. power |
15124.90 |
15184.96 |
15064.96 |
60.06 |
59.94 |
0.40 |
-0.40 |
|
|
Electrical power |
Sinus |
16648.27 |
16719.55 |
16577.00 |
71.27 |
71.27 |
0.43 |
-0.43 |
|
|
VFD |
16648.27 |
16884.73 |
16411.82 |
236.46 |
236.46 |
1.42 |
-1.42 |
||
|
Motor Efficiency |
Sinus |
90.8 |
91.6 |
90.1 |
- |
- |
0.8 |
0.7 |
|
|
VFD |
90.8 |
92.5 |
89.2 |
- |
- |
1.7 |
1.6 |
||
From the above analysis, the following guidelines should be followed in order to keep the measurements within reasonable accuracy range.
- Torque transducer calibrated (& compensated for error) before start of test
- Ensure zero reading at no load
- Precision power analyzers to be calibrated every six months. The consequence of this is that instrument needs to be taken out from test rig for number of days and thus are not available for measurements.
Motor efficiency measurement for testing motor
The efficiency of the test motor is measured using direct input-output and segregation of loss methods outlined in the IEC standard specifications (IEC 60034-2-1 & IEC00034-2-3). The measurements have been carried out with both sinusoidal and variable frequency drive supply conditions.
Motor loss and efficiency determination under sinusoidal supply
Motor efficiency is measured under sinusoidal supply conditions as per the test procedure outlined in IEC60034-2-1. First the heat run test performed at different loading conditions and the efficiency is measured as per direct input-output method. This is followed by indirect efficiency measurement as described in "Method 2- summation of losses, residual losses estimated from stray losses". The different results from above tests are summarized Table 7 for sinusoidal supply conditions.
Table 7: Measured loss and efficiency under sinusoidal supply
|
Load torque [%] |
Direct input-output method |
Indirect method (Method-B)- loss segregation |
|||
|
Loss [W] |
Efficiency [%] |
Loss [W] |
Efficiency [%] |
||
|
(Pin - PL)/Pin |
Pout/(Pout + PL) |
||||
|
115 |
1892.5 |
90.2 |
1836.0 |
90.5 |
90.4 |
|
100 |
1523.4 |
90.8 |
1464.3 |
91.2 |
91.2 |
|
75 |
1053.5 |
91.6 |
1016.7 |
91.9 |
91.9 |
|
50 |
757.8 |
91.2 |
718.2 |
91.6 |
91.6 |
|
25 |
598.4 |
87.3 |
558.3 |
88.1 |
88.0 |
Motor loss and efficiency determination with VFD supply
The efficiency of the test motor is also measured with variable frequency drive supply at similar load conditions using direct and indirect test method. The motor is now supplied from a Gozuk industrial VFD which operates the motor at rated speed in speed control mode. As outlined in IEC 60034-2-3, "test method 2-3-B summation of losses- Manufacturer specific VFD supply, additional harmonic loss determination using final application specific VFD" is used to determine motor loss components and "test method 2-3-C Input-Output method" is used to measure motor losses directly (The method is similar to the method 1 Direct input-output power measurement described in IEC 60034-2-1).
The different results from above tests are summarized Table 7 for sinusoidal supply conditions and in Table 8 for variable frequency drive supply conditions. Figure 2 shows the motor efficiency under sinusoidal and variable frequency drive supply conditions, whereas the motor losses under different loading condition are shown in Figure 3.
Table 8: Measured loss and efficiency with variable frequency drive supply at rated speed of 1500 rpm
|
Load torque [%] |
Direct input-output method |
Indirect method (Method-B) |
|||||
|
Loss [W] |
ΔL [%] |
η [%] |
Loss [W] |
ΔL [%] |
|
η [%] |
|
|
(Pin - PL)/Pin |
Pout/(Pout + PL) |
||||||
|
115 |
1936.2 |
2.3 |
89.2 |
1932.7 |
5.3 |
89.2 |
89.2 |
|
100 |
1692.1 |
11.1 |
89.8 |
1598.6 |
9.2 |
90.4 |
90.3 |
|
75 |
1126.2 |
6.9 |
91.0 |
1084.6 |
6.7 |
91.3 |
91.3 |
|
50 |
797.5 |
5.2 |
90.7 |
775.4 |
8.0 |
91.0 |
91.0 |
|
25 |
601.1 |
0.5 |
87.4 |
558.3 |
0.0 |
88.3 |
88.2 |
Figure 2: Comparison of motor efficiency under sinusoidal and variable frequency drive supply conditions
Figure 3: Comparison of motor losses under sinusoidal and variable frequency drive supply conditions
It is observed that the efficiency measured with direct input – output method is lower than that determined using indirect method. This is true for both sinusoidal as well as variable frequency drive supply conditions. The measured efficiency value at rated load confirm to the IE2 efficiency level under sinusoidal supply condition. The efficiency decreases under variable frequency drive supply, owing to the increase in iron losses (additional harmonic losses in the motor iron core, rotor eddy current losses, etc.). The relative increase in losses due to variable frequency drive supply is also indicated in Table 8 as a percent of sinusoidal losses at similar load conditions. It is observed from Table 8 that the maximum increase is ~11% and 9 % for measurements using direct input-output method and indirect summation of loss method, respectively. The losses in sinusoidal and variable frequency drive supply conditions cannot be compared at 115% load conditions because of the VFD voltage limitations at this operating point. The estimation of uncertainty in the above described efficiency values is the main aim of this paper. This has been addressed in next section where the measurement uncertainties are estimated based on the procedure described in previous section and then compared with specified tolerance limits in standard specifications.
Estimation of measurement uncertainties for direct input output method
The procedure for estimation of measurement uncertainties, described in previous section, is carried out for all load conditions for both sinusoidal and variable frequency drive supply conditions. To analyze the effect of line filters on measurement uncertainty, the measurement uncertainties are estimated for both the cases – with and without use of filter function (scenario B and C respectively) for sinusoidal and variable frequency drive supply conditions. Then the resulting values are compared with tolerance limits to evaluate if the measurement is satisfactory or not.
Uncertainty estimation without line filter (Scenario B)
The measured values of voltage, current and power quantities as well as current range selected by the instruments are used to derive the uncertainties at different load conditions for sinusoidal supply conditions. The results are reported in Figure 4 for efficiency values and in Figure 5 for measured loss values. Similar exercise is also carried out to determine measurement uncertainty for measurement tests with variable frequency drive supply conditions. The respective values are also shown in Figure 4 and Figure 5 for efficiency and measured loss respectively. The various scaling factors for different measurement instruments are taken from Table 3 for variable frequency drive supply conditions.
Uncertainty estimation with line filter active (Scenario C)
The enabling of line filter function in power analyzers inserts the line filter into the voltage and current measurement input circuit, it directly affects the voltage, current, and power measurements. This results in filtering of input voltage and current signals. High frequency components are filtered out depending upon the selected cut-off frequency. The line filter has minimal effect on measurements in the situation when motor is supplied with sinusoidal voltages, but the measurements in case of variable frequency drive voltages are affected by line filter selection. The accuracy specifications of the power analyzers are thus dependent upon line filter state since activating line filter adds additional scaling factor in uncertainty estimation as described in Table 3.
The effect of line filter on the measurement uncertainty is estimated by considering scaling of power analyzer accuracy values as described in Table 3. The overall uncertainty in motor efficiency and motor losses under sinusoidal supply conditions is shown in Figure 6 and Figure 7, respectively. The measurement uncertainty for variable frequency drive supply condition is also estimated as described above and the results are shown in Figure 6 and Figure 7 for motor efficiency and motor losses, respectively.
Figure 4: Measurement uncertainty in motor efficiency values without line filters
Figure 5: Measurement uncertainty in motor losses without line filters
Figure 6: Measurement uncertainty in motor efficiency values with line filters
Figure 7: Measurement uncertainty in motor losses with line filters
Comparison of measurement uncertainty with tolerance limits
The recommended error tolerance limits for motor efficiency as per IEC 60034-1 applicable to induction motor of 15 kW power rating is -15% of (1- η). Based on the measured efficiency values at different load conditions the tolerance limits are calculated for both sinusoidal and variable frequency drive supply conditions. The results are shown in Figure 8 with dotted lines (blue- sinusoidal supply condition, red- variable frequency drive supply). Figure 8 also shows the estimated uncertainty in efficiency from actual measurements for both variable frequency drive and sinusoidal supply conditions (continuous blue and red lines). Figure 8 (a) shows the comparison of estimated uncertainty when the line filter function was not used. In this condition, the actual uncertainty is well below the maximum tolerance levels for both sinusoidal and variable frequency drive supply conditions.
Similar procedure is followed for the case when the line filter function is activated. The comparison between estimated uncertainty and tolerance limits are shown in Figure 8 (b). In this scenario, the estimated uncertainty for sinusoidal supply test is lower than the tolerance levels but it exceeds the limits in case of variable frequency drive supply conditions. Thus the line filter function is having adverse effects in measurements with variable frequency drive supply conditions. The measurement uncertainty is more than manufacturing tolerance limits.
Figure 8: Estimated tolerance limits in motor efficiency at rated speed (dotted curve- maximum tolerance limits - 15% of (1-η) as per IEC60034-1 standard specification)
Similar comparison is also mode for motor losses. Figure 9 (a) shows measurement uncertainty (% of total loss) in motor loss for the case when line filter is in disabled condition. The tolerance limits in motor losses are defined as -10% of motor loss as per IEC 60034-1 (for motor rating >150 kW). But for lower than 150 kW motor rating, the tolerance limits are not described. Hence, it is assumed to be equal 15% (tolerance limits for efficiency values). It is seen that the measurement uncertainty in case of sinusoidal supply are well within tolerance limits (<6%), whereas with variable frequency drive supply it is much higher (7-10%) depending upon load conditions.
The similar procedure is followed for the scenario in which line filter is enabled and the resulting measurement uncertainty values are shown in Figure 9(b). Clearly, line filter has adverse effect under both sinusoidal and variable frequency drive conditions. The results for sinusoidal supply conditions are approximately 10%, but for a variable frequency drive supply test, the measurement uncertainty is greater than manufacturing tolerance levels (i.e. 15%). The uncertainty in motor loss at 100% and 115% load conditions is lower than respective value at 75% load condition. This is because of the selection of "auto scale mode" of power analyzer which automatically selects the best scaling factor for depending upon the RMS value of measured quantity.
Figure 9: Measurement uncertainty in motor losses
The following conclusions can be drawn from the foregoing analysis of measurement uncertainty estimation:
- It is evident from the foregoing analysis that the measurements under sinusoidal supply conditions are performed while keeping the measurement uncertainty well below manufacturing tolerance levels defined in IEC 60034-1. But the scenario is different when the measurements with variable frequency drive supply are performed on same measurement setup. The estimated uncertainties are much larger as compared to sinusoidal supply case.
- Activating line filter function cause the measurement uncertainty go exceed above allowed tolerance limits defined in IEC 60034-1. The use of line filter calls for additional scaling factors while estimating measurement uncertainties. The estimated uncertainty in case of measurements with sinusoidal supply are still within tolerance limits even when the line filter function in power analyzers is activated.
- But with line filter in enabled state, the overall estimation of uncertainties levels actually exceeds the allowed tolerance limits when the measurements are performed with variable frequency drive supply conditions. Thus efficiency measurement with variable frequency drive supply must be performed without enabling line filter function. When the motor efficiency is measured at lower speeds under variable frequency drive supply, the voltage, current waveforms contains much higher harmonics. This poses the problems with zero crossing detection of voltage and/or current waveforms and calculation of fundamental frequency becomes difficult. In this situation, it is essential to activate the line filters otherwise the fundamental frequency and thus rest parameters are not calculated properly.
- The motor efficiency measurement under variable frequency drive supply conditions is very tricky owing to above conflicting requirements about line filters.
Conclusions
The paper presents the effect of instrument accuracies on the overall uncertainty in efficiency measurement described as in direct input-output methods as per IEC 60034-2-1. The measurement instrumentation normally has higher error margins for variable frequency drive supply conditions as compared to sinusoidal supply. This results in higher values of estimated uncertainty in efficiency during measurement under variable frequency drive supply conditions. The efficiency measurement is performed on an induction motor under both sinusoidal and VFD controlled supply conditions at rated speed. The percentage increase in motor losses during VFD controlled supply is found to be linearly increasing with respect to load condition. This is very different observation than the assumption made in IEC 60034- 2-3 that the additional motor loss due to VFD controlled supply is independent of motor loading.
Then the uncertainty estimation is performed on measured efficiency under both sinusoidal and VFD controlled supply conditions. It is observed from estimated uncertainty values are below maximum limits described as per IEC 60034-1 standard specification when measurements are performed with line filter functions in power analyzers is disabled. This is applicable for both sinusoidal and VFD control measurement tests. But measurement uncertainty is much higher when line filters are activated for measurements with variable frequency drive supply conditions. In this situation, the estimated uncertainty values are very close or higher than allowed tolerance limits. It is recommended that the use of line filters should be avoided under such situations.
Post a Comment:
You may also like:
Featured Articles
What is VFD, How it works? - VFD ...
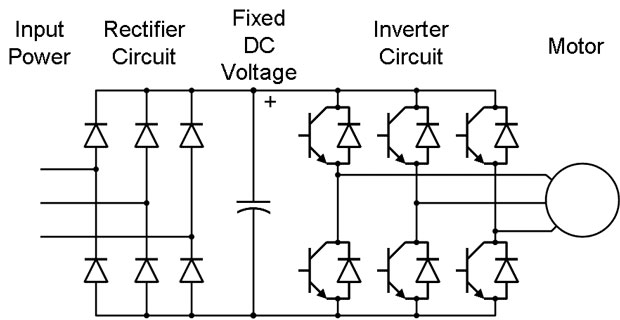 VFD is shorted for Variable Frequency Drive (also known as AC Drives and Inverters) -- that's used to make an AC motor working in ...
VFD is shorted for Variable Frequency Drive (also known as AC Drives and Inverters) -- that's used to make an AC motor working in ...Variable frequency drive Rectifier
 To understand variable frequency drive (VFD) better, it's necessary to explain some of the main parts of the variable frequency ...
To understand variable frequency drive (VFD) better, it's necessary to explain some of the main parts of the variable frequency ...VFD: Insulated Gate Bipolar Transistor ...
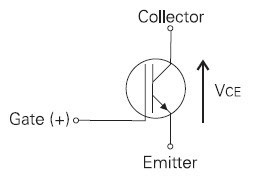 IGBT (insulated gate bipolar transistor) provides a high switching speed necessary for PWM VFD operation. IGBTs are capable of ...
IGBT (insulated gate bipolar transistor) provides a high switching speed necessary for PWM VFD operation. IGBTs are capable of ...Three phase inverters
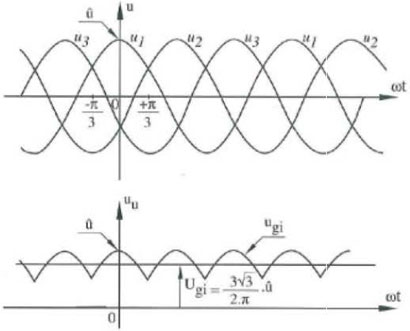
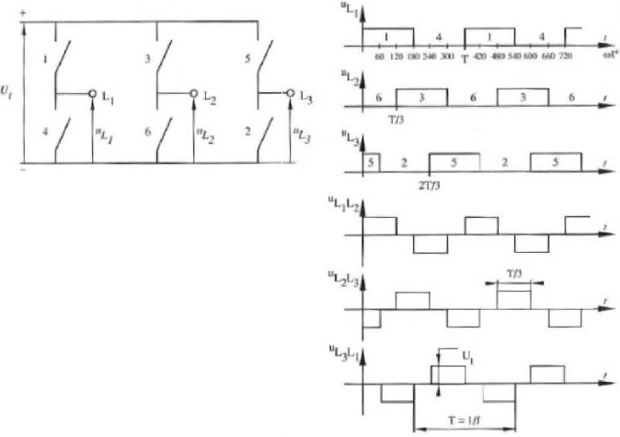 In the variable frequency drive rectifier paper, it explains how to go from three phase alternating current voltage to a direct ...
In the variable frequency drive rectifier paper, it explains how to go from three phase alternating current voltage to a direct ...Variable Frequency Drive Harmonics and ...
A discussion of the benefits of variable frequency drives often leads to a question regarding electrical harmonic distortion ...

VFD manufacturers